EURJPY Technical Analysis
EURJPY Technical Analysis.
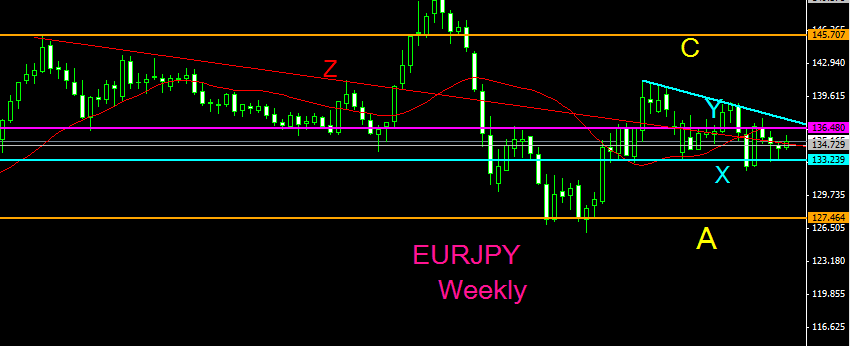
Weekly:
Price is reacting on a major resistance zone and congesting in an ascending triangle marked by X and Y aqua lines which is cut through by a major red trendline marked Z. The triangle still has a bearish bias but a confirmed break of the Y trendline can lead to retest the zone of the previous high around 145.707 marked by the C orange horizontal resistance. A break of the X horizontal support may lead to retest of lows around the 127.464 support zone marked by the horizontal trendline marked A.
Daily:
 The same zones as the weekly are the same major resistance and support zones. The magenta horizontal line marked S is a major daily resistance zone. The momentum is clearly still weak on the upswings compared to the strong down swings therefore a bearish bias but this can only be confirmed by the break of the X horizontal support. There fore watch for reactions on the Y and X trendline for the next swing move up or done as discussed on the weekly analysis.
 The same zones as the weekly are the same major resistance and support zones. The magenta horizontal line marked S is a major daily resistance zone. The momentum is clearly still weak on the upswings compared to the strong down swings therefore a bearish bias but this can only be confirmed by the break of the X horizontal support. There fore watch for reactions on the Y and X trendline for the next swing move up or done as discussed on the weekly analysis.
No comments:
Post a Comment